Stock
Is your stock covered?
Which products will run short before the next delivery lands, how much revenue sits behind those gaps, and which purchase orders arrive too late to help.
The stock coverage diagnosisSupply-chain analytics
I work with the data you already have, from stock and purchase orders to deliveries and sales, and rank what I find by the money at stake.
Write to meWhat I answer
Stock and delivery questions draw on the same data, so they can be answered together in one diagnosis.
Stock
Which products will run short before the next delivery lands, how much revenue sits behind those gaps, and which purchase orders arrive too late to help.
The stock coverage diagnosisDeliveries
How late your shipments really arrive, by sea, air or road, and what the delays add up to in extra charges. You also see which carriers and lanes you can plan on.
The late delivery diagnosisOther
Dashboards, KPIs, forecasts, or a question your current reports can't answer. If the data exists, we can look at it together.
Write to meProcess
Stock list, purchase orders, sales history, delivery dates. Exports from your ERP or spreadsheets are enough, and you don't need to give me system access or install anything.
Every figure is checked against your source data and can be traced back to where it came from.
A short report that ranks what I found by the money at stake, walked through with you in a call.
Evidence
The diagnoses run on tools I built. The demos below use synthetic data for a fictional company, so you can explore them freely.
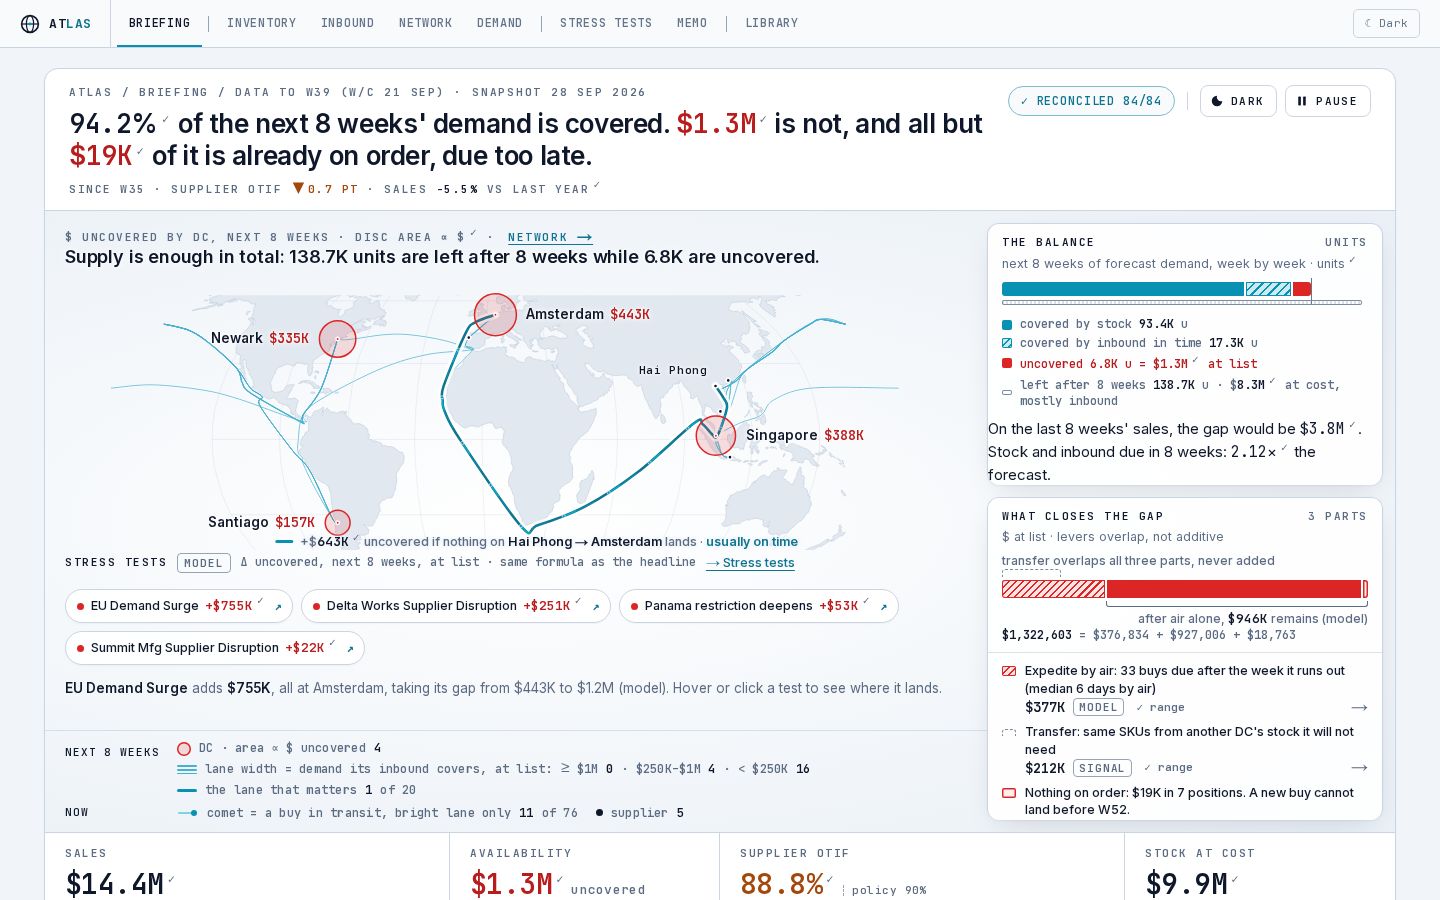
ATLAS checks stock coverage for a fictional footwear brand: what is covered, what is on order, and what arrives too late.
Open the live demo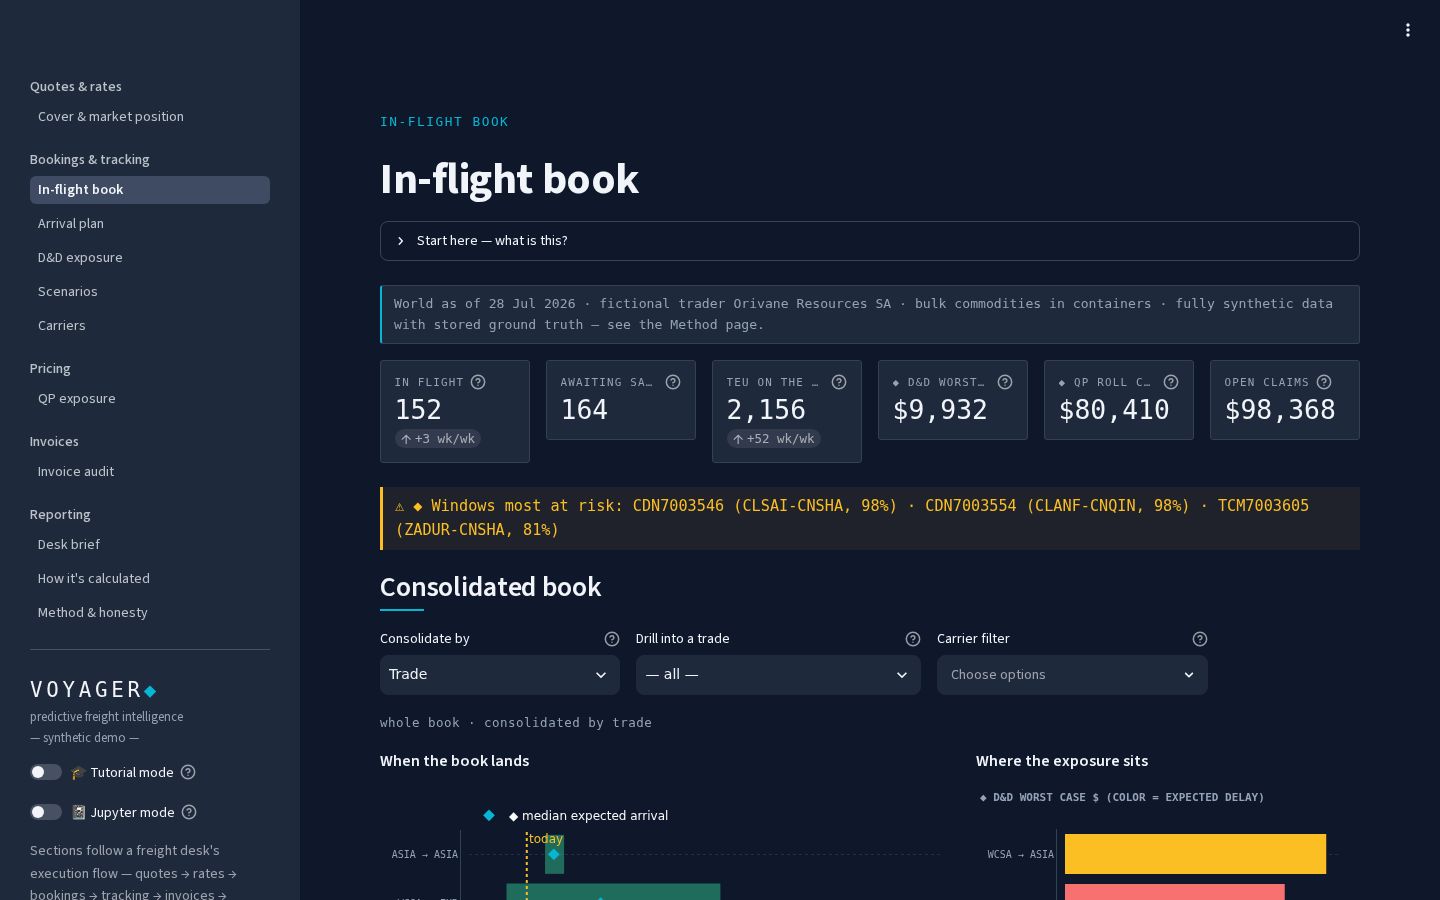
Voyager estimates arrival ranges and delay costs for a fictional importer's container shipments.
Open the live demoBackground
I have worked in international trade and logistics for over 20 years, and for the last 14 I have been turning supply-chain data into decisions. My background spans freight forwarding and running supply-chain reporting for a manufacturing group with operations on three continents.
More of my work, including forecasting, simulation and freight-analysis tools, is on the Work page.